Figure 2 shows the structure of
the fundamental warping mode:
(a) the  -distribution of the perturbations
averaged vertically and
(b) the
-distribution of the perturbations
averaged vertically and
(b) the  -distribution of the perturbations.
For the sake of convenience,
in Fig. 2(a), we averaged
-distribution of the perturbations.
For the sake of convenience,
in Fig. 2(a), we averaged  over
over  and
velocity vectors over
and
velocity vectors over  ,
where
,
where  is the half-thickness
of the maser emission region shown in Fig. 1.
Note that the horizontal velocities as well as
is the half-thickness
of the maser emission region shown in Fig. 1.
Note that the horizontal velocities as well as  are reversed
in the lower half of the disc.
For the purpose of comparison between the numerical results
and the observations,
we draw Fig. 2 such that the disc rotates clockwise.
In Fig. 2(b), we superposed the poloidal velocity vectors
on the enthalpy perturbation,
are reversed
in the lower half of the disc.
For the purpose of comparison between the numerical results
and the observations,
we draw Fig. 2 such that the disc rotates clockwise.
In Fig. 2(b), we superposed the poloidal velocity vectors
on the enthalpy perturbation,  ,
despite that the former phase lags behind the latter phase by
,
despite that the former phase lags behind the latter phase by  .
The period of the mode is
.
The period of the mode is  ,
which is about
,
which is about  times longer than the rotation period
at
times longer than the rotation period
at  .
.
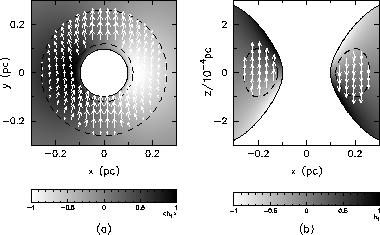
Figure 2: Structure of the fundamental warping mode.
a The  -distribution of the perturbations
averaged vertically over the upper half of the disc;
the distribution is reversed in the lower half.
b The
-distribution of the perturbations
averaged vertically over the upper half of the disc;
the distribution is reversed in the lower half.
b The  -distribution of the perturbations.
A gray-scale representation denotes
-distribution of the perturbations.
A gray-scale representation denotes  .
Arrows superposed on the gray-scale plot are
the perturbed velocity vectors in the maser emission region
(surrounded by dashed lines)
.
Arrows superposed on the gray-scale plot are
the perturbed velocity vectors in the maser emission region
(surrounded by dashed lines)
Figure 2 shows several basic features
of the fundamental warping mode.
Firstly,  and the horizontal component of the perturbed velocity
are approximately
proportional to the vertical coordinate
and the horizontal component of the perturbed velocity
are approximately
proportional to the vertical coordinate  ,
whereas the vertical component of the perturbed velocity
is approximately constant in the z-direction.
Secondly, the velocity vector
associated with the warping mode is approximately vertical.
The ratio of the horizontal velocity component
to the vertical component is roughly
,
whereas the vertical component of the perturbed velocity
is approximately constant in the z-direction.
Secondly, the velocity vector
associated with the warping mode is approximately vertical.
The ratio of the horizontal velocity component
to the vertical component is roughly  .
Thirdly, the amplitudes of
.
Thirdly, the amplitudes of  and the vertical velocity component
decrease with radius.
Note that the first and the third features are consistent with
the observed spatial distribution
of high-velocity maser components of NGC 4258
[compare Fig. 2 with Fig. 2 of Miyoshi et al. (1995)].
Note also that the second feature is in agreement with
the observed near-Keplerian
velocity distribution of maser sources of NGC 4258.
and the vertical velocity component
decrease with radius.
Note that the first and the third features are consistent with
the observed spatial distribution
of high-velocity maser components of NGC 4258
[compare Fig. 2 with Fig. 2 of Miyoshi et al. (1995)].
Note also that the second feature is in agreement with
the observed near-Keplerian
velocity distribution of maser sources of NGC 4258.
Observationally, the line-of-sight velocity distribution of
high-velocity maser components are fitted with a Keplerian disc model
with such a high accuracy that the velocity residuals are
less than a few  (Greenhill et al. 1995b).
However,
the line-of-sight velocity distribution of low-velocity components
significantly deviates from the Keplerian
curve of the high-velocity components.
It is offset redward by
(Greenhill et al. 1995b).
However,
the line-of-sight velocity distribution of low-velocity components
significantly deviates from the Keplerian
curve of the high-velocity components.
It is offset redward by  (Nakai et al. 1995).
In addition,
the slope for low-velocity components with
(Nakai et al. 1995).
In addition,
the slope for low-velocity components with  (hereafter, blueshifted low-velocity features)
is slightly flatter than that with
(hereafter, blueshifted low-velocity features)
is slightly flatter than that with  (hereafter, redshifted low-velocity features),
where
(hereafter, redshifted low-velocity features),
where  is the line-of-sight velocity
relative to the systemic velocity
[see Fig. 19(b) of Nakai et al. (1995)].
This, together with the fact that the drift velocity
of low-velocity components is larger
(
is the line-of-sight velocity
relative to the systemic velocity
[see Fig. 19(b) of Nakai et al. (1995)].
This, together with the fact that the drift velocity
of low-velocity components is larger
( ) at
) at  than
that (
than
that ( ) at
) at  , suggests that
blueshifted low-velocity features lie at
, suggests that
blueshifted low-velocity features lie at  times
the radii of the redshifted features
(Greenhill et al. 1995b; Nakai et al. 1995).
times
the radii of the redshifted features
(Greenhill et al. 1995b; Nakai et al. 1995).
It is obvious that any warped disc model fails if only the vertical component of the perturbed velocity is taken into account. The vertical velocity component consistent with the spatial distribution of the high-velocity maser features of NGC 4258 shifts the line-of-sight velocity of low-velocity features blueward. In order to explain the observed redward-offset, the inward velocity component has to be included.
One possible way to include the inward velocity component in our model is to assume that maser features arise only from the upper-half (z>0) part of the disc, which is closer to the line-of-sight through the central pumping source than the lower-half part.
Based on this assumption, we calculate
the line-of-sight velocity distribution of maser features
in the disc perturbed by the warping mode.
For this purpose,
we assume the nonlinear perturbation pattern similar to the linear mode
shown in Fig. 2.
We use the velocity field averaged vertically over
 .
We normalize the amplitude of the perturbation such that
the vertical component of the perturbed velocity at
.
We normalize the amplitude of the perturbation such that
the vertical component of the perturbed velocity at  is
10% of the Keplerian velocity.
We take into account
the redshift of maser features from the unperturbed disc,
is
10% of the Keplerian velocity.
We take into account
the redshift of maser features from the unperturbed disc,
which amounts to  ,
where c is the speed of light
[see, e.g., Eq. (A9) of Okazaki et al. (1987)].
,
where c is the speed of light
[see, e.g., Eq. (A9) of Okazaki et al. (1987)].
Figure 3 shows the model position-velocity diagram.
The thick solid lines denote the line-of-sight velocity distribution
of maser sources
which lie along the x-axis (high-velocity components).
Two thin solid lines are for maser sources
lying along the radii  and
and  .
These radii correspond to the observed drift velocities
of blue- and red-shifted low-velocity features, respectively.
.
These radii correspond to the observed drift velocities
of blue- and red-shifted low-velocity features, respectively.
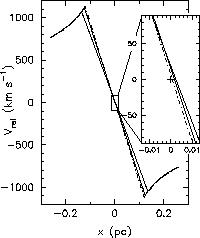
Figure 3: Position-velocity diagram for the disc perturbed by
the fundamental warping mode.
The inset is an enlargement of the low-velocity maser features.
The inclination angle of the disc is  .
The thick solid lines denote the line-of-sight velocity distribution
of maser sources
which lie along the x-axis (high-velocity components).
Two thin solid lines are for maser sources lying
along
.
The thick solid lines denote the line-of-sight velocity distribution
of maser sources
which lie along the x-axis (high-velocity components).
Two thin solid lines are for maser sources lying
along  and
and  ,
which correspond to the observed drift velocities
of blue- and red-shifted low-velocity features, respectively.
For comparison purpose,
we present
,
which correspond to the observed drift velocities
of blue- and red-shifted low-velocity features, respectively.
For comparison purpose,
we present
the line-of-sight velocity distribution
for sources lying along  in the unperturbed disc
(dash-dotted line).
The cross in the inset indicates the origin of the diagram
in the unperturbed disc
(dash-dotted line).
The cross in the inset indicates the origin of the diagram
From Fig. 3, we immediately observe the following characteristics of the model diagram:
 ] expected for
the unperturbed disc.
] expected for
the unperturbed disc.
Finally, we stress that the warping modes can be excited by several mechanisms. In this paper, we have neglected the effects of viscosity, disc self-gravity, and radiation-pressure force, and, consequently, have treated neutral modes. The viscous force can make m=1 modes overstable in accretion discs (Kato 1989). The disc self-gravity can also excite m=1 modes through the interaction between long waves (e.g., Adams et al. 1989).
Moreover, the radiation-driven warping of discs can occur far from central radiation sources (Pringle 1996; Begelman 1996).
It is highly desirable to study if these mechanisms work for the particular case of NGC 4258.