We now consider the variabilities in the line profiles from disks with m=1 perturbation patterns. Our interests are in whether the line profiles exhibit variabilities similar to the observed V/R variations, and how the variabilities depend on the adopted perturbation patterns.

Figure 4 shows the line profiles at a phase of 0.25
for different values of
 ,
,  , and
, and  .
Recall that the profile asymmetry is largest at phases of 0.25 and 0.75.
The inclination angle of the disk is
  .
The left panels are for
  and
the right panels for
  .
The panels, from top to bottom, are
for
  20, 10, and 5, respectively.
In each panel four profiles are shown for different values of
the characteristic optical depth
  .
They are for
 ,
,  , 10, and
  from top to bottom, respectively.
On both sides of each profile, we give the intensity of the higher peak
normalized so that the peak intensity of the unperturbed profile
for
  is unity
and the maximum optical depth
  .
Here,
  is defined by
the maximum value among the optical depths along rays
through the entire disk,
and is regarded as an approximation to
  .
.
Note that the line profiles exhibit remarkable V/R asymmetries for a wide range of disk parameters. Furthermore, note that the line center velocity of each optically-thick profile is negative; in other words, the profile as a whole shifts in the direction of the weaker emission component. Thus, the line-profile variabilities from disks with m=1 perturbation patterns are in agreement with the global characteristics of the observed V/R variations.

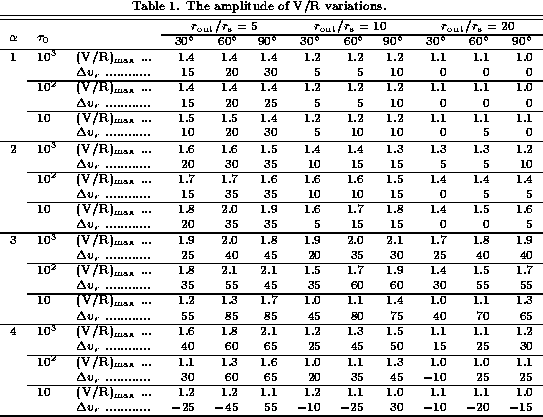
To study the model line profiles in more detail,
we give in table 1 two quantities
which characterize the behavior of the line-profile variation.
One is the maximum value of the V/R ratio  ,
which is defined by the ratio of the violet and red
peak intensities.
The other is the radial-velocity displacement
 defined by
the mean of the violet and red peak velocities
at the phase of the maximum V/R ratio.
Recall that
  for the observed V/R variations of the Balmer lines.
Let us consider the characteristics of the line-profile variabilities
caused by m=1 perturbation patterns.
First, we note from table 1 that
 for a wide range of disk parameters.
This means that (in general terms)
the one-armed oscillation scenario agrees well with
the observed V/R variations.
Note that this result is insensitive to the details
of the model.
Second, we also note that the value of
 is sensitive to the detailed form
of the perturbation patterns adopted.
In the present model, for
  ,
the V/R ratio varies with a large amplitude,
while no significant profile-shift occurs.
In contrast, the disks with
  exhibit large-amplitude V/R variations
similar to the observed variations
for a wide range of disk sizes and optical depths.
This difference in the profile variabilities arises from the difference
in the perturbed disk structures for
 and
and  .
Recall that for
  , the peak velocity is
equal to the velocity at the disk outer radius,
while for
  it is equal to the velocity
at the radius within which the disk is optically thick
for the line.
For
  and
and  ,
the latter radius is about 3, 4, and 7 for
  10,
10,  ,
and
,
and  , respectively.
In our model, the amplitude of the perturbation
at the disk outer radius for
  is much smaller than
that at the radius with the optical depth about unity
for
  .
As a result, the profile shift for
  is much smaller
than that for
  .
The reason why the amplitude of the V/R variation
for
  is large
irrespective of
  is that the amplitude of the perturbation
is large even at the disk outer radius.
Note that, in principle, the disk-structure dependent feature
of the line-profile variabilities can be used to probe
the disk structure of Be stars,
although the present model is too simple to enable us to extract
any detailed information concerning the disk structure
from the observed variabilities.

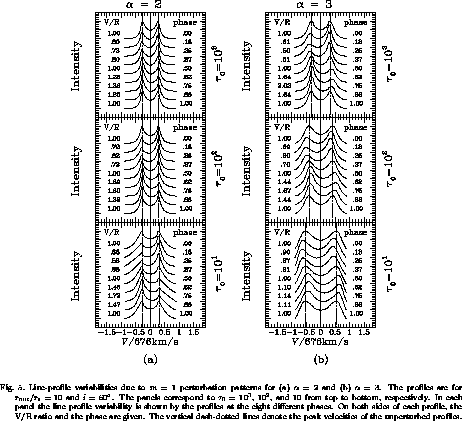
To illustrate the behavior of the profile variations more explicitly,
we present some examples of the V/R variations
in figure 5.
In this figure,  and the inclination angle i is
  .
Figure 5 shows the line-profile variabilities due to the fundamental modes
for
  (left) and
  (right).
The oscillation periods of the modes are
 for
for  and
and  for
for  .
The panels correspond to
 ,
,  , and 10 from top to bottom, respectively.
In each panel the line-profile variability is shown
by the profiles at eight different phases.
The vertical dash-dotted lines denote the peak velocities
of the unperturbed profiles.
For
  ,
the peak velocities show little time variabilities,
although the V/R ratios vary significantly.
In contrast, for
  ,
the peak velocities as well as the V/R ratios
exhibit remarkable variations when
  .
Note that the range of
  for these remarkable variations roughly covers
the observed range of H
 -line optical depth.
In summary, line profiles from the disks perturbed by
the m=1 perturbation patterns exhibit long-term V/R variations
similar to the observed variations of the Balmer lines.
These V/R variations occur for a wide range of disk sizes
( ) and optical depths
(
 ).
In the present model, the amplitude of the V/R variation
is larger for disks with steep (
 ) density gradients
than for disks with flat (
 ) density gradients.