Using the method described in Paper I,
we can solve the linearized equations for
isothermal perturbations in the form of normal modes
which vary as  .
As mentioned above, the eigenmodes obtained are qualitatively
the same as those in Paper I.
They naturally explain some of the observational features
of the long-term V/R variations of Be stars.
However, since these eigenmodes are linear,
the model does not predict either the amplitude
of the variation or the behavior of the profile shift.
It is thus very important to study even qualitative effects of
m=1 oscillations on the line profiles.
.
As mentioned above, the eigenmodes obtained are qualitatively
the same as those in Paper I.
They naturally explain some of the observational features
of the long-term V/R variations of Be stars.
However, since these eigenmodes are linear,
the model does not predict either the amplitude
of the variation or the behavior of the profile shift.
It is thus very important to study even qualitative effects of
m=1 oscillations on the line profiles.
For this purpose, we assume that the nonlinear perturbation patterns are similar to the linear eigenfunctions. We normalize the amplitude of the perturbation so that the maximum value of the perturbed part of the angular velocity is 10% of the unperturbed part. This value is adopted for clearly illustrating the effects of m=1 perturbations on the line profiles. Based on this assumption, we investigate in later sections whether m=1 perturbation patterns cause V/R variations similar to the observed variations of the Balmer lines.
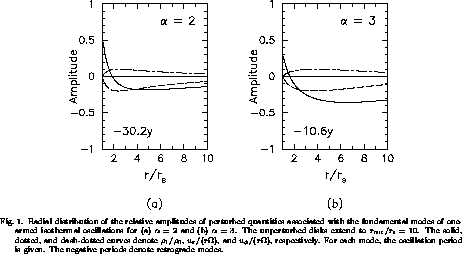
Figure 1 shows the radial distributions of the relative amplitudes
of some perturbed quantities
associated with the fundamental modes
for (a)  and (b)
  .
The unperturbed disk extends up to
.
The unperturbed disk extends up to
 .
The solid, dotted, and dash-dotted curves
denote
.
The solid, dotted, and dash-dotted curves
denote  ,
,  , and
, and  ,
respectively.
Here,
,
respectively.
Here,  is the Eulerian perturbation of the density
and
is the Eulerian perturbation of the density
and  and
and  are the horizontal components
of the velocity field associated with the perturbation.
Note that
are the horizontal components
of the velocity field associated with the perturbation.
Note that
 and
and  vary as
  ,
while
,
while  varies as
  .
For each mode we present the oscillation period.
The negative periods denote retrograde modes.
.
For each mode we present the oscillation period.
The negative periods denote retrograde modes.
It is immediately observed that the density perturbation
anticorrelates with the angular-velocity perturbation,
except in the innermost ( ) region.
Hence, we expect that the fundamental m=1 mode shifts
a double-peaked emission-line profile in the direction
of the weaker emission component, unless
the emission from the innermost region is dominant.
Note that this profile shift is just one of the typical properties of
the observed long-term V/R variations of Balmer lines.
) region.
Hence, we expect that the fundamental m=1 mode shifts
a double-peaked emission-line profile in the direction
of the weaker emission component, unless
the emission from the innermost region is dominant.
Note that this profile shift is just one of the typical properties of
the observed long-term V/R variations of Balmer lines.